

Chrome DevTools is a set of web developer tools built directly into the Google Chrome browser. DevTools lets you edit pages on-the-fly and diagnose problems quickly, which helps you build better websites, faster.
— Chrome for Developers
Intro to Browser Dev Tools
The browser developer tools (often called “dev tools”) are built-in features in web browsers like Chrome, Firefox, and Edge that help you inspect and debug websites. They let you see how a website is built, showing you the HTML, CSS, and JavaScript behind the scenes. With dev tools, you can test changes, track down bugs, and understand how a website behaves without editing the actual code. It’s a powerful tool for both beginners and experienced developers to fine-tune their websites and improve performance. Plus, it’s easy to access—just right-click on any webpage and select “Inspect” to get started.
Go to your favorite website and press: ctrl + shift + i or F12 to open developer tools. All browsers pretty much have the same keyboard shortcut. Also, you can use your mouse too. Just press the right button and select Inspect. This will also open the dev tools panel.
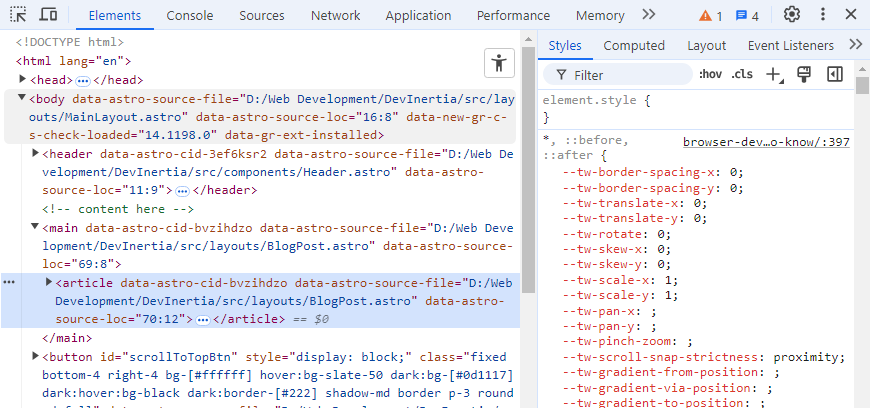
fig: Browser devtools Panel
Now we can start exploring things in it, lets go.
Design Mode
document.designMode = "on";
It will enable the design mode. You can now directly customize your website content within UI. But remember, the changes you made will reset if you reload your browser. It will not affect the original website (Other’s dev tools operations too)
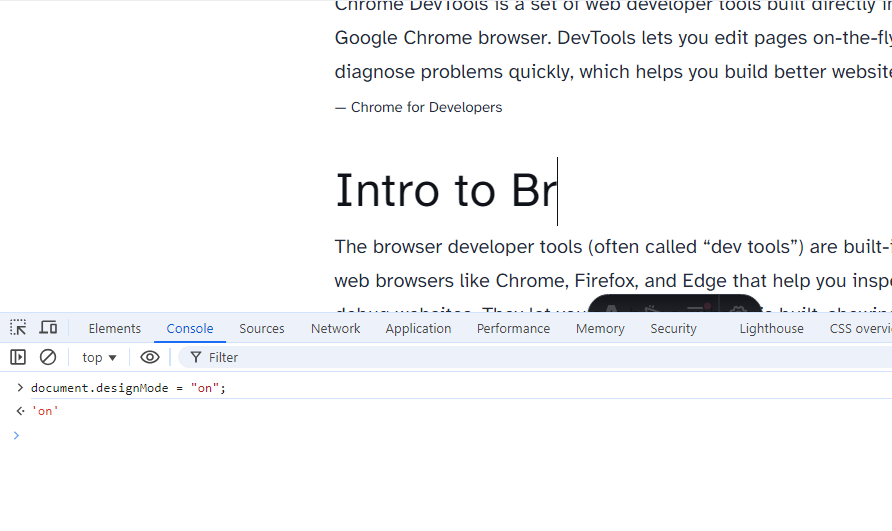
fig: Design mode enabled
With the help of this command you can update your bank balance and become billionaire overnight :). Just don’t reload the window ok? 😅
Command Palette
Like code editors and IDEs dev tool has also command palette. Type ctrl + shift + p to open the command palette. Here you will see many important tools like node screenshot, css overview, translation, debugging etc. Lets say I have a <article>...</article> which contains lots of contents. I want to capture a screenshot for it. I can use Capture node screenshot screenshot option for it. Move to the Elements tab of the dev tools and then click over that element you want to take a screenshot and press ctrl + shift + p, search for Capture node screenshot and press on it.
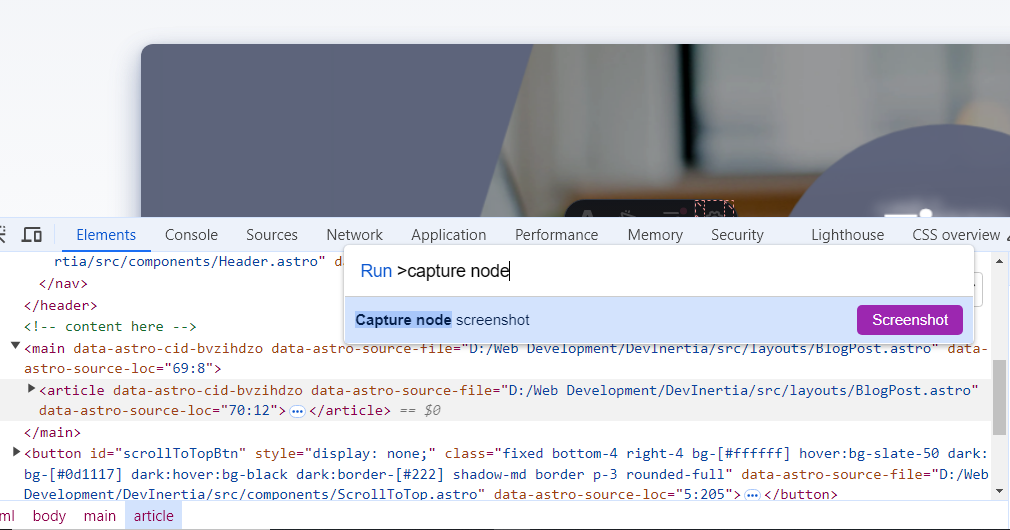
fig: Capture node screenshot
Code Coverage
Now move on to the ‘Sources’ tab. Here you will find all of the source or static files of that website. You can select a file to view or view it’s details reports about unused code in the initial run. If it’s your site you can then modify your code or remove those dead code to improve performance.
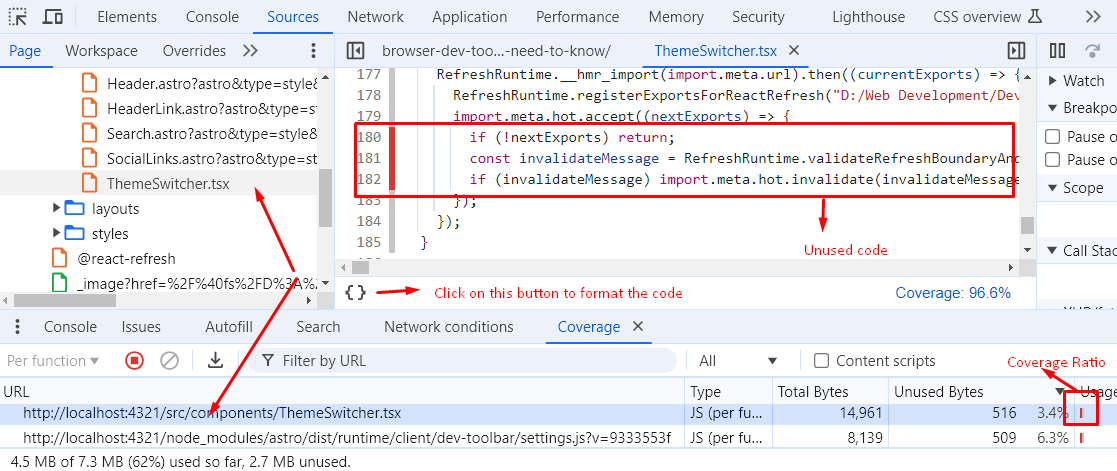
fig: Code coverage report
$ selectors
In the console we can write plain js and do everything we want. But do you know we have a $ exist in the browser console? It’s behave like JQuery. $0 will return the current selected element from Elements tab. $('h1') will return the first <h1> element. $$('p') will return all the <p> existed on that page.
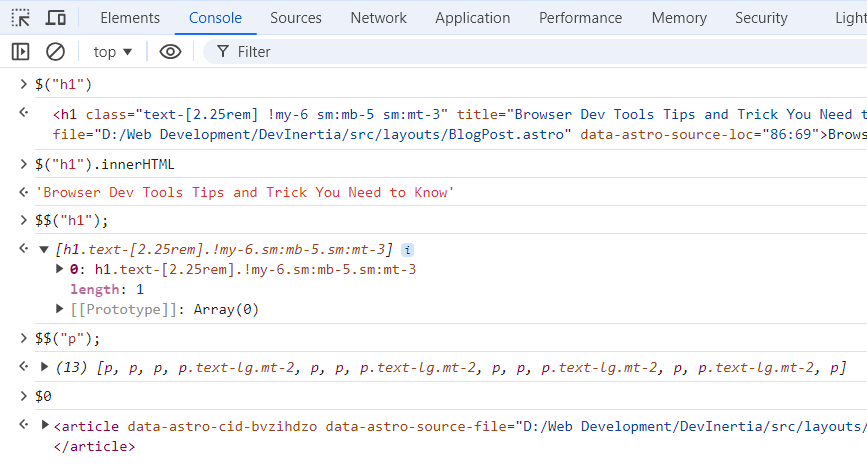
fig: Common Jquery selectors
Network Management
If you need to preview or manipulate network, Network tab here for you. Go to the Network tab and reload the browser on the bottom you will see all the request list that the browser sending to the server and getting back the response. Also, you can view the response headers, payload, cookies and preview response.
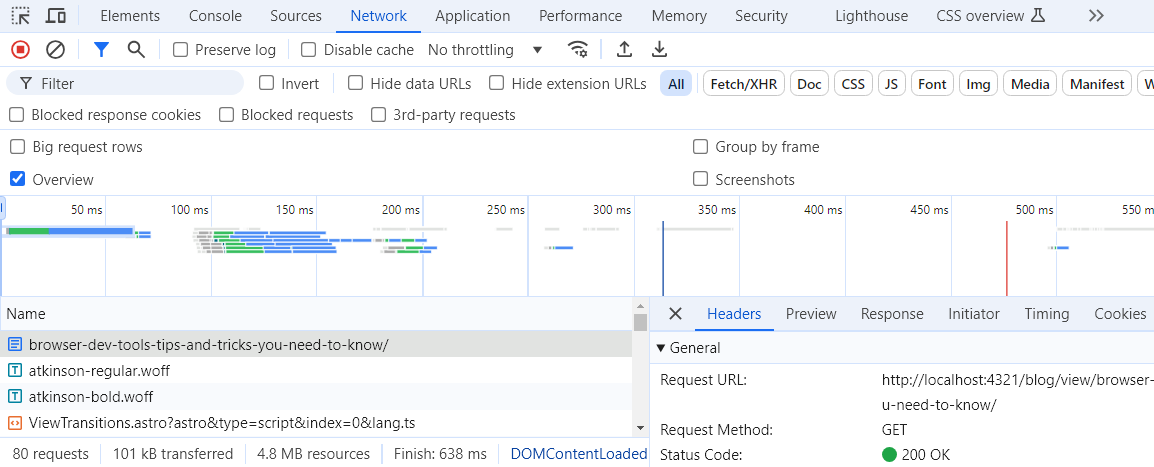
fig: Network tab
Browser Storage
Browser storage refers to the various methods for storing data on a user’s browser. This data can be used by websites to remember user preferences, keep users logged in, or even track behavior across sessions. The three main types of browser storage are cookies, session storage, and local storage. You can find all of these storages info in Application tab.
Cookies are small text files stored on a user’s browser by a website. They are often used to store session data, track user behavior, and manage authentication (like keeping a user logged in). Cookies can have expiration dates, meaning they can either be temporary (session cookies) or last for a longer period (persistent cookies).
fig: Cookie Storage
Session Storage allows websites to store data that is specific to the current browser session. This data is cleared as soon as the tab or browser window is closed. Unlike cookies, session storage is not sent with server requests, making it ideal for temporary data that only needs to exist for the current session.
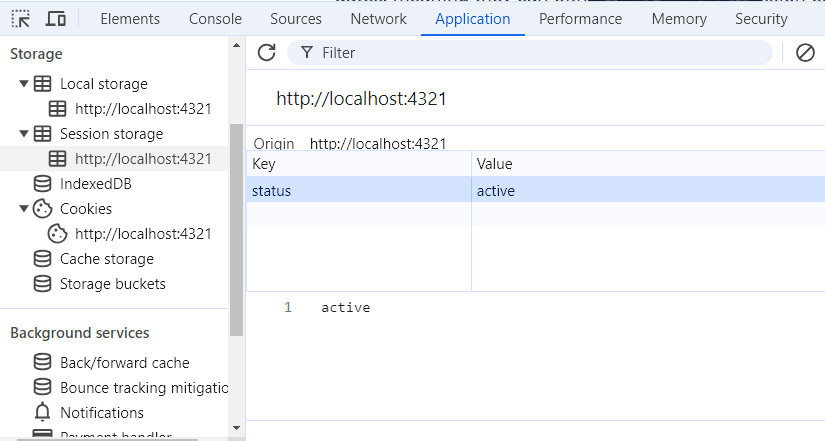
fig: Session Storage
Local storage is similar to session storage but persists even after the browser is closed. This means that data stored here will remain until explicitly cleared by the user or by the website’s code. It is useful for storing long-term data such as user settings, preferences, or cached content.
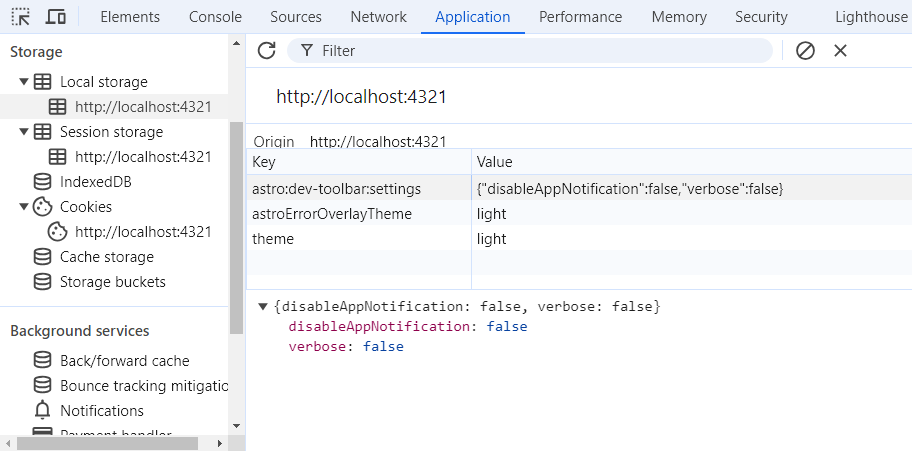
fig: Local Storage
There is plenty tools available in the dev tools like layers, performance monitoring, memory management it is not possible to complete all at once. I will write the next part very soon.